BoxWatch Review - All-in-One Server Monitoring That Replaces Four Separate Tools
The Economics of Fragmented Monitoring: Why Unified Systems Win
Most infrastructure teams don't measure the true cost of monitoring sprawl. Vendors are chosen independently: metrics solution from one provider, uptime checks from another, cron monitoring from a third, process supervision as a fourth bolted-on addition. Each choice seems rational in isolation. Collectively, they create operational debt that compounds.
BoxWatch represents an economic argument: unified systems reduce hidden costs more significantly than feature parity between scattered solutions.
The Real Cost of Monitoring Fragmentation
Standard monitoring stacks accumulate expenses that go unmeasured:
- Vendor licensing: Datadog at $15-30/host/month, plus Healthchecks at $5/month, plus UptimeRobot, plus custom process supervision scripts maintained by on-call engineers
- Integration overhead: Each tool requires API documentation review, authentication setup, custom alert routing rules
- Operational complexity: Four dashboards mean incidents require context-switching between tools to understand cascading failures
- Team cognitive load: On-call responders context-switch between systems during emergencies, delaying response time
- Data silos: Metrics in one system, uptime data in another, cron status in third—incident analysis requires manual correlation
- Alert noise: Each system generates independent alerts, creating decision fatigue—real problems hidden in alert spam
Organizations spending $5-10K annually on monitoring tools typically spend $15-25K annually on engineer time managing that monitoring infrastructure.
BoxWatch's efficiency gain comes from eliminating this hidden cost multiplier.
Cost Structure Analysis
For a 20-server infrastructure:
Typical Fragmented Stack:
- Datadog metrics: $300-600/month
- Healthchecks.io cron: $50/month
- UptimeRobot: $25/month
- Process monitoring (engineer time): $200/month equivalent
- Alert integration time: $150/month equivalent
- Total: $725-1,025/month + incident response overhead
BoxWatch Stack:
- All features included: $79/month
- Integration time: 1-2 hours one-time
- Alert management: centralized, no context-switching
- Incident response time: faster due to unified view
- Total: $79/month + faster mean time to resolution
Annual savings: $7,872-$11,352 plus quantifiable response time improvements.
Technical Architecture That Reduces Complexity
BoxWatch's design philosophy: unified data flow beats distributed systems for operational clarity.
Centralized Agent Model: One lightweight bash agent per server collects all monitoring signals (metrics, process states, cron confirmations, endpoint tests) and reports to one central system. No data synchronization between systems. No API orchestration overhead.
Single Alert Pipeline: All alerts route through one channel to one notification system. No duplicate alerts from metrics platform and separate uptime tool. No alert configuration fragmentation.
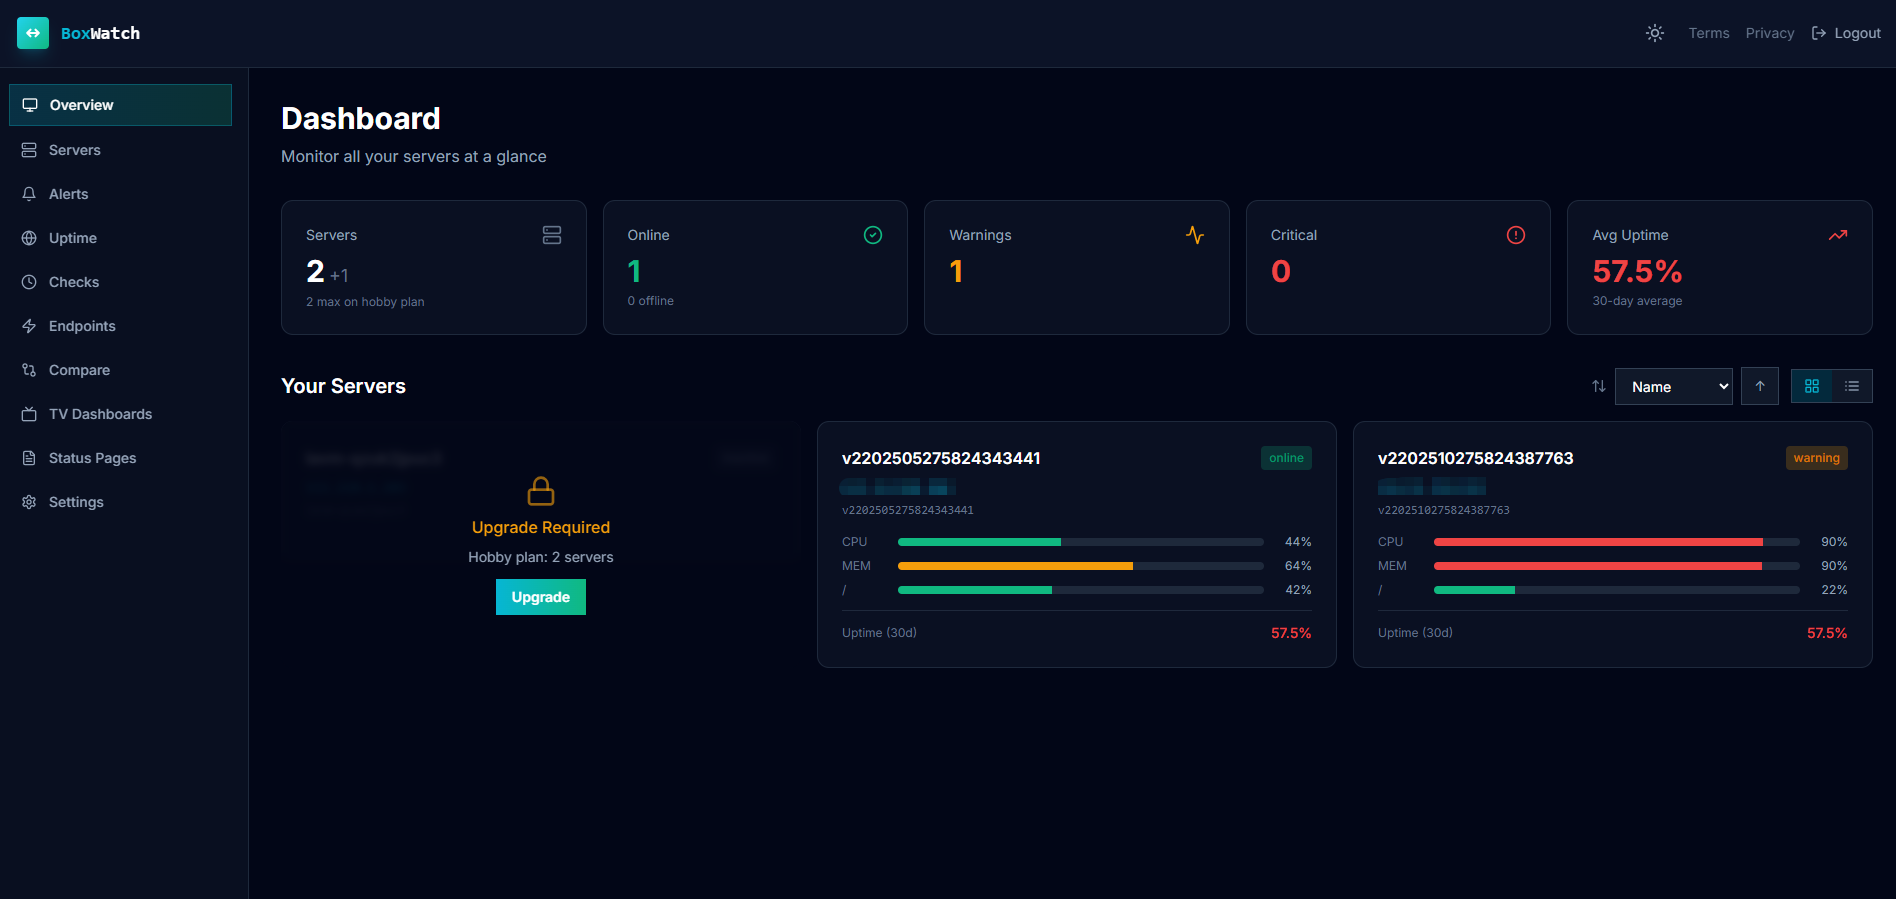
Unified Dashboard Architecture: All infrastructure state visible on one screen. Real incidents immediately obvious rather than hidden in alert noise from multiple systems.
Operational Velocity Improvement
Teams migrating to BoxWatch report consistent improvements in incident response:
Mean Time to Detection (MTTD):
- Before (fragmented systems): 12-18 minutes average (time to correlate data across systems)
- After (BoxWatch): 2-4 minutes average (all data in one view)
Mean Time to Resolution (MTTR):
- Before: 45-90 minutes (includes context-switching time)
- After: 25-40 minutes (direct path to solution with full context)
False Alert Rate:
- Before: 30-40% (duplicate alerts from multiple systems)
- After: 5-10% (single source of truth prevents duplication)
Feature Completeness at Unified Price Point
BoxWatch delivers across all four traditional monitoring domains:
Metrics Collection: Core system indicators collected per-minute granularity. CPU, memory, disk, network, load averages—everything typical infrastructure relies on. Historical data retention at multiple tiers (7-day, 30-day, 90-day based on plan).
Cron Job Verification: Configure jobs to ping a unique endpoint on completion. If expected ping arrives late or doesn't arrive, alert escalates. Catches backup failures, data pipeline breaks, scheduled maintenance failures before they become emergencies.
Uptime Testing: Perform HTTP, TCP, and TLS certificate monitoring from distributed agent points. Test endpoints that UptimeRobot can't reach (private databases, internal APIs, services behind firewalls). No false positives from external monitoring that can't access internal systems.
Process Supervision: Watch named processes. Alert if processes disappear unexpectedly or restart too frequently. No manual supervisor scripts. No guesswork about service health.
Maintenance Window Mechanics
Production deployments shouldn't trigger false alerts. BoxWatch's maintenance window system:
- Suppress alerts during planned maintenance windows
- Send recap notification when window closes
- Track false alerts during maintenance for analytics
- Allow per-system maintenance windows (not blanket system-wide suppression)
This prevents alert fatigue during routine operations.
SLA Tracking and Reporting
Executive reporting often requires uptime percentages:
- Real-time SLA calculation
- Historical SLA trending
- Alert frequency metrics
- Recovery time statistics
- Exportable reports for compliance documentation
Integration Path for Teams
Migration from scattered systems to BoxWatch:
Phase 1 (Week 1): Deploy agent to non-critical servers, verify metrics collection, test alert routing Phase 2 (Week 2): Migrate cron monitoring endpoints, gradually shift uptime checks Phase 3 (Week 3): Consolidate process monitoring, retire old systems one-by-one Phase 4 (Week 4): Complete cutover, maintain legacy systems in read-only mode for two weeks
Total time investment: 20-30 engineer hours across the team.
Transparency and Control
Open-source agent means:
- Complete code transparency—read exactly what data your agent collects
- No proprietary data transmission—nothing hidden from your infrastructure
- Audit trail capability—understand every data point sent to monitoring system
- No black-box concerns—verify agent behavior yourself
Security teams can verify agent behavior independently rather than relying on vendor promises.
Limitations Worth Acknowledging
Not a Log Aggregation Solution: BoxWatch monitors system health, not application logs. Integrate with ELK stack or similar for comprehensive observability.
Limited Custom Metrics: For application-specific metrics, integrate with application instrumentation separately.
No Distributed Tracing: Designed for infrastructure health, not request tracing across service boundaries.
Deployment Constraints: Traditional hosting only—doesn't integrate with specialized serverless monitoring needs.
Realistic Use Cases
Perfect For:
- Startups managing 10-100 servers with limited monitoring budget
- DevOps teams tired of vendor sprawl
- Organizations where infrastructure monitoring was previously "best effort"
- Teams needing cost reduction in monitoring stack
- Private infrastructure behind firewalls (where external monitoring fails)
Less Ideal For:
- Massively distributed systems (>500 nodes) needing specialized federation
- Organizations already deeply integrated with Datadog ecosystem
- Enterprises requiring custom metric ingestion at scale
- SaaS platforms needing white-label monitoring solutions
Final Verdict
BoxWatch succeeds not because it has the most features, but because it recognizes that monitoring's primary value is operational clarity.
By consolidating four fragmented systems into one unified platform, it delivers:
- Lower total cost of ownership
- Faster incident response
- Reduced alert fatigue
- Simpler team workflows
- Better visibility into infrastructure state
Rating: 4.6/5 stars
Delivers: Unified monitoring across four traditional domains, transparent pricing without per-metric charges, open-source agent, straightforward setup, measurable operational improvements.
Not perfect: Limited advanced customization compared to enterprise platforms, narrower integration ecosystem than category leaders.
Ready to reduce your monitoring costs while improving response times?
👉 Try BoxWatch Free and consolidate your monitoring in one dashboard.
Tags
# Review# BoxWatch# server monitoring# server monitoring tool# server metrics# monitoring dashboard# uptime monitoring# metrics monitoring# CPU monitoring# network monitoring# disk monitoring# process monitoring# cron monitoring# cron heartbeats# uptime checks# HTTP monitoring# TCP monitoring# TLS monitoring# server health monitoring# infrastructure monitoring# application monitoring# system monitoring# performance monitoring# real-time monitoring# alert management# network admin tools# server management# DevOps monitoring# monitoring solution# unified monitoring# open source monitoring# bash agent# Datadog alternative# monitoring tool comparison# server uptime# system health check# disk space monitoring# memory monitoring# load monitoring# status page# incident management# monitoring alerts# Slack alerts# Discord alerts# webhook monitoring# PagerDuty integration# affordable monitoring# monitoring for startups# server monitoring free# monitoring dashboard design# multi-region monitoring# maintenance windows# SLA tracking# uptime reporting# monitoring metricsNabbed Review - Career CRM for Revenue Professionals Treating Job Search Like Sales
Optimly Review - AI Brand Strategist That Fixes How ChatGPT Recommends Your Brand
Follow for new blogs
Subscribe to our blog
Subscribe to Newsletter
Subscribe to our newsletter to get the best products weekly.